Line Graph
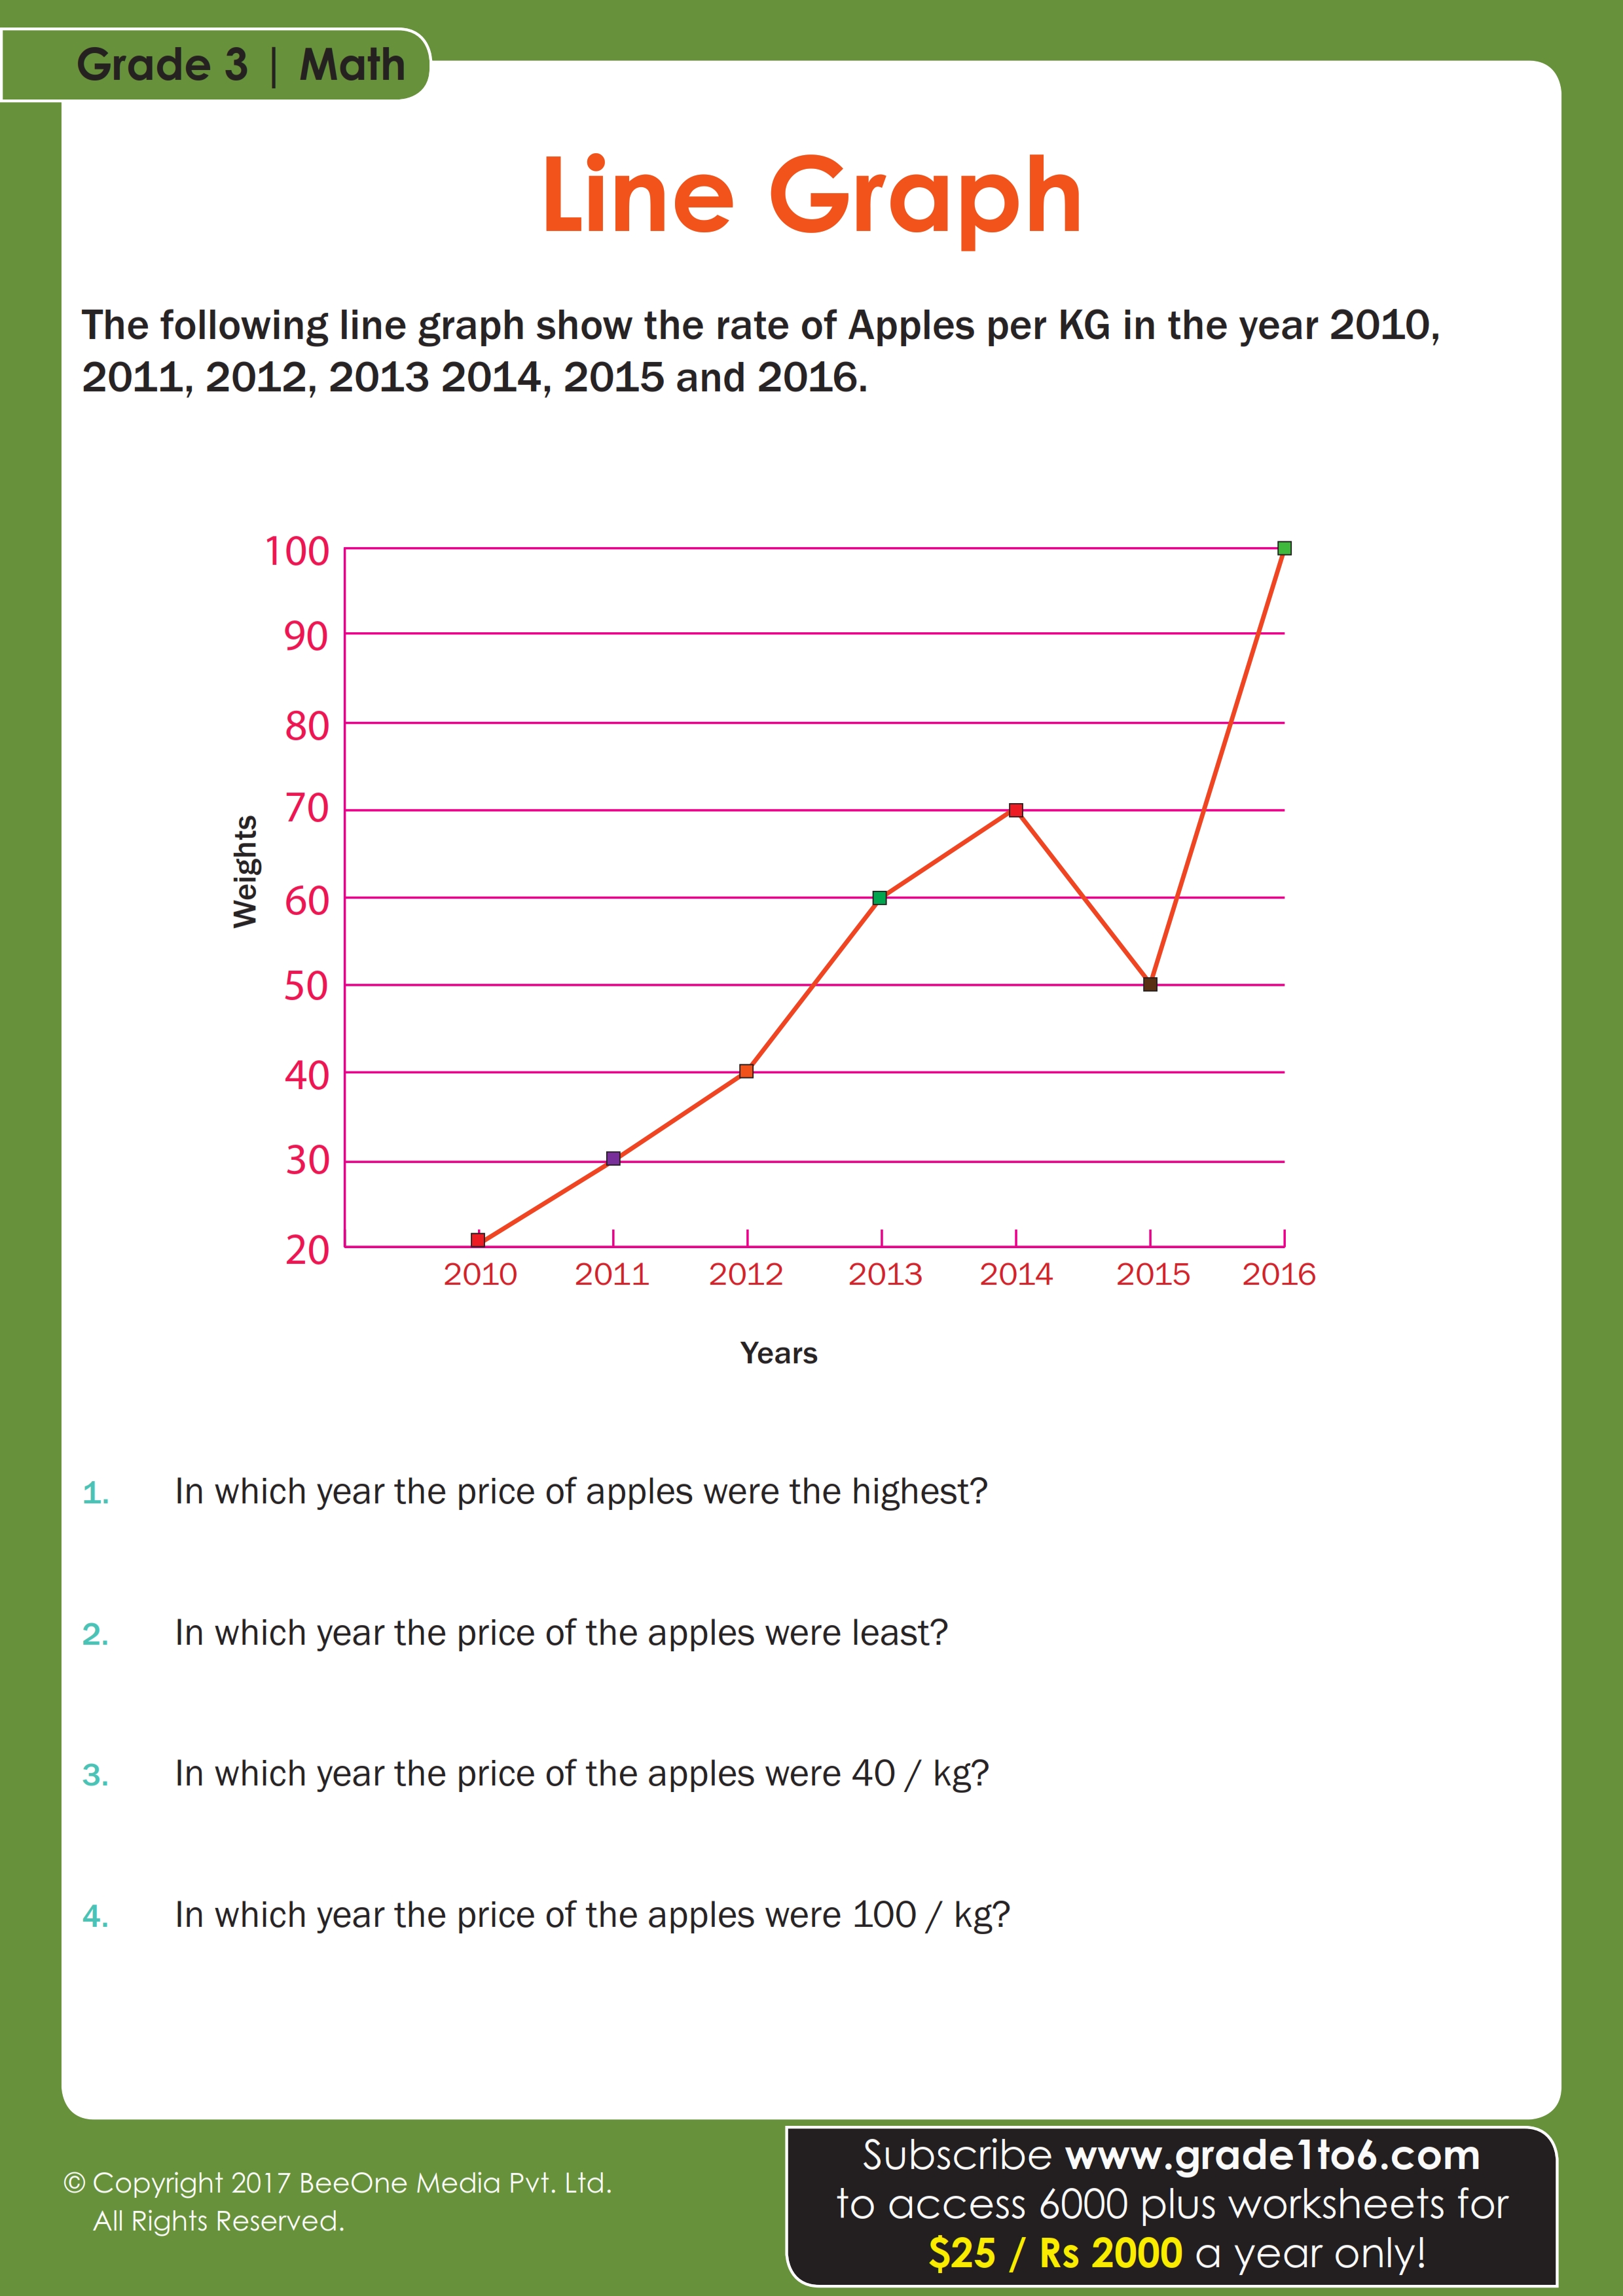
Line graphs typically display how data changes over time. Practice on this Line graph worksheet for Grade 3 where students analyze rate of apples sold over the years.
Subscribe www.grade1to6.com for full access of 6000 plus Math and English worksheets for Grade 1 to 6.
Download Now