Getting Started
How it works?
FAQ
Subscription
Free Worksheets
Nursery and KG
Grade 1 Math
Grade 2 Math
Grade 3 Math
Grade 4 Math
Grade 5 Math
Grade 6 Math
Grade 1 English
Grade 2 English
Grade 3 English
Grade 4 English
Grade 5 English
Grade 6 English
Members Login
IB Worksheets
Grade 1
English
Maths
Grade 2
English
Maths
Grade 3
English
Maths
Grade 4
English
Maths
Grade 5
English
Maths
Grade 6
English
Maths
CBSE Worksheets
Grade 1
English
Maths
Grade 2
English
Maths
Grade 3
English
Maths
Grade 4
English
Maths
Grade 5
English
Maths
Grade 6
English
Maths
Digital Products
Nursery and KG
IB Workbooks
Grade 1
English
Maths
Grade 2
English
Maths
Grade 3
English
Maths
Grade 4
English
Maths
Grade 5
English
Maths
Grade 6
English
Maths
CBSE Workbooks
Grade 1
English
Maths
Grade 2
English
Maths
Grade 3
English
Maths
Grade 4
English
Maths
Grade 5
English
Maths
Grade 6
English
Maths
Common Core
Grade 1
English
Maths
UK
Grade 1
English
Maths
Grade 7
English
Maths
Grade 8
English
Maths
Grade 9
English
Maths
Grade 10
English
Maths
Assessments
About Us
Meet our Team
Social Initiative & News
Contact
School Shop
Follow Us
Facebook
Pinterest
YouTube
LinkedIn
Twitter
Blog
Getting Started
How it works?
FAQ
Subscription
Free Worksheets
Nursery and KG
Grade 1 Math
Grade 2 Math
Grade 3 Math
Grade 4 Math
Grade 5 Math
Grade 6 Math
Grade 1 English
Grade 2 English
Grade 3 English
Grade 4 English
Grade 5 English
Grade 6 English
Members Login
IB Worksheets
Nursery and KG
Grade 1
English
Maths
Grade 2
English
Maths
Grade 3
English
Maths
Grade 4
English
Maths
Grade 5
English
Maths
Grade 6
English
Maths
Grammar
CBSE Worksheets
Grade 1
English
Maths
Grade 2
English
Maths
Grade 3
English
Maths
Grade 4
English
Maths
Grade 5
English
Maths
Grade 6
English
Maths
Grammar
Digital Products
Nursery and KG
IB Workbooks
Grade 1
English
Maths
Grade 2
English
Maths
Grade 3
English
Maths
Grade 4
English
Maths
Grade 5
English
Maths
Grade 6
English
Maths
CBSE Workbooks
Grade 1
English
Maths
Grade 2
English
Maths
Grade 3
English
Maths
Grade 4
English
Maths
Grade 5
English
Maths
Grade 6
English
Maths
UK
Grade 1
English
Maths
Grade 7
English
Maths
Grade 8
English
Maths
Grade 9
English
Maths
Grade 10
English
Maths
Assessments
About Us
Meet our Team
Social Initiative & News
Contact
School Shop
Follow Us
Facebook
Pinterest
YouTube
LinkedIn
Twitter
Blog
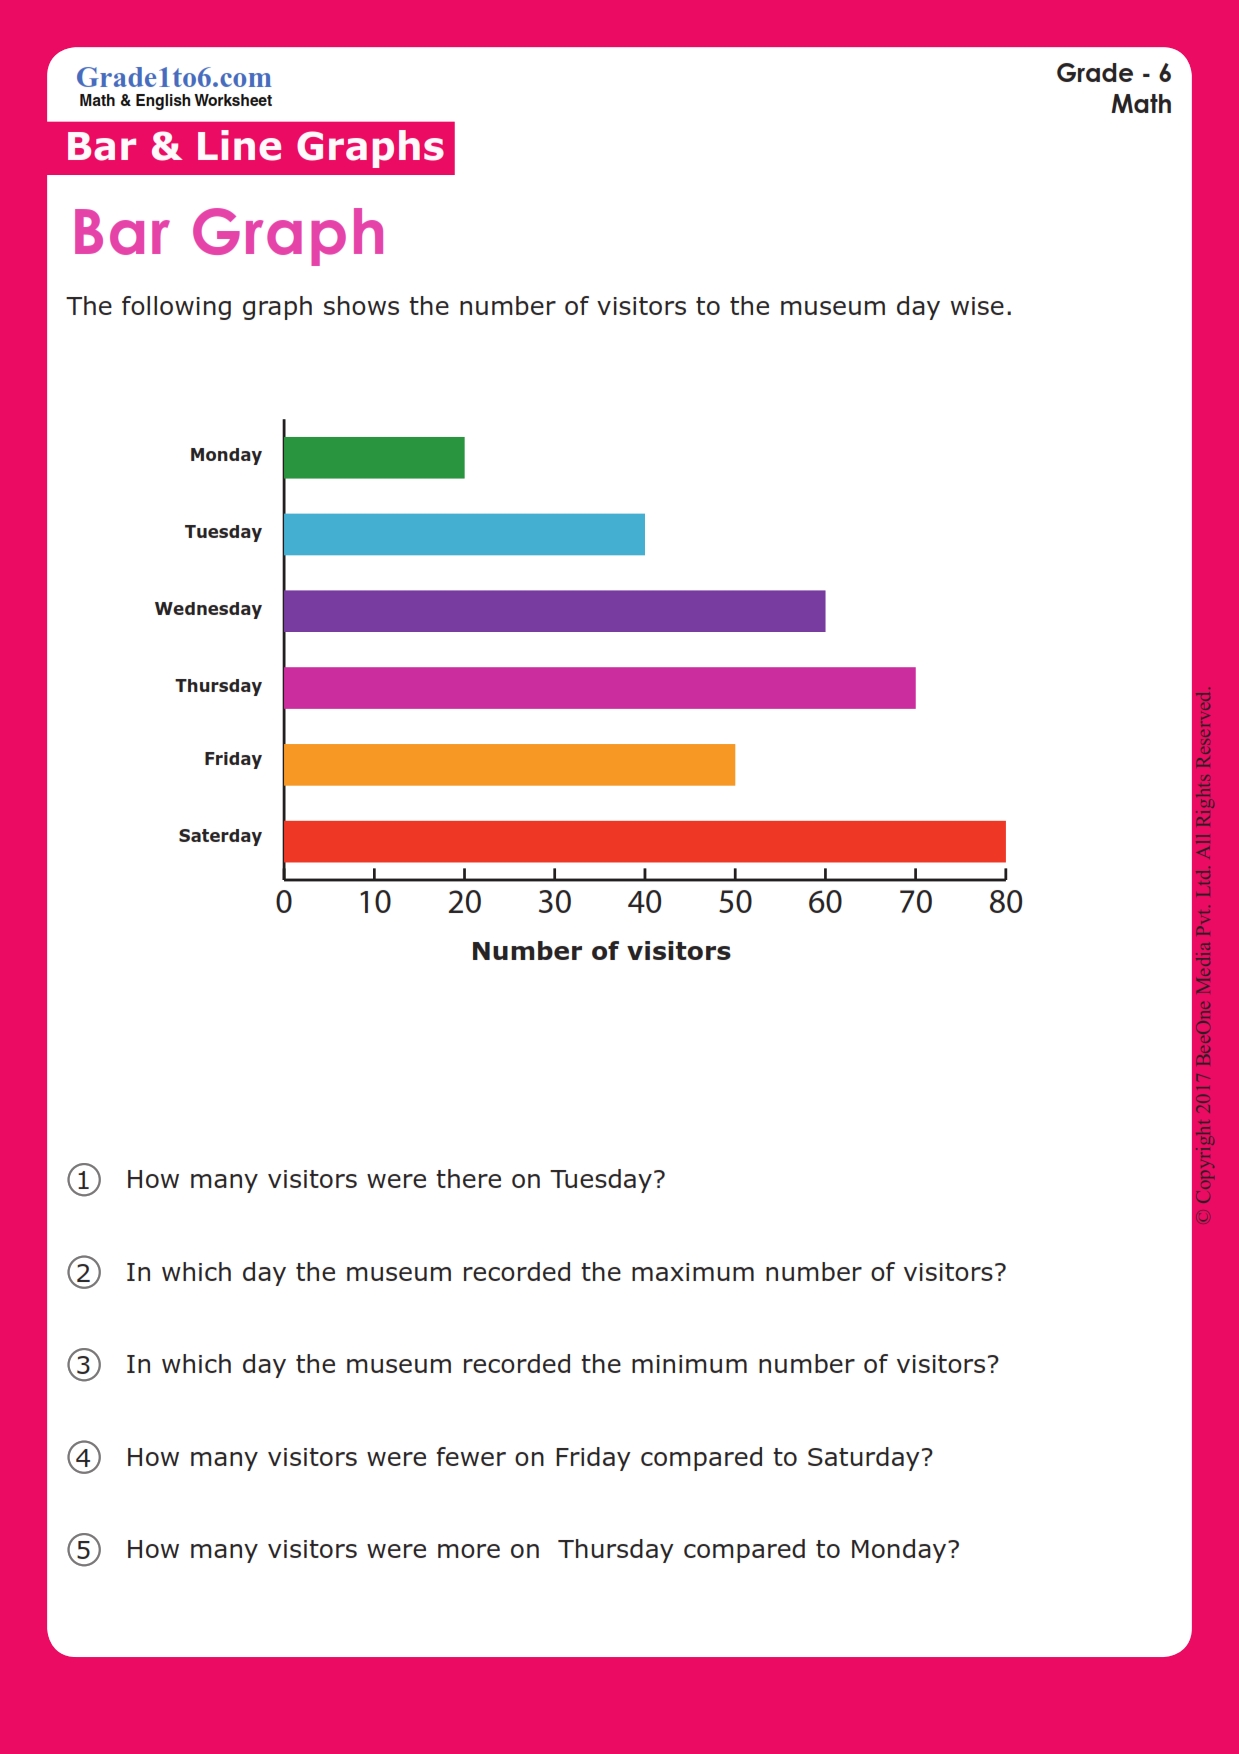
Bar Graphs
This Bar Graph shows the number of saplings planted by students of Grade 6 in 2016. Answer the questions seeing the Bar Graph, Worksheets for Grade 6. Rated 4.7/5 by Teachers in TpT.
Download Now